Organizations running Apache Kafka as their streaming platform need comprehensive monitoring to maintain reliable operations. Without proper visibility into broker health, resource utilization, and data flow metrics, teams risk service disruptions, data loss, and degraded performance that can impact critical business operations. Effective monitoring and alerting are essential to detect anomalies early, from high system load to connectivity issues, enabling teams to take preventive action before problems affect production workloads.
Amazon Managed Streaming for Apache Kafka (Amazon MSK) addresses these monitoring challenges by publishing detailed metrics to Amazon CloudWatch. The service emits metrics at 1-minute intervals for provisioned (Standard) clusters, with flexible monitoring levels (DEFAULT, PER_BROKER, PER_TOPIC_PER_BROKER, or PER_TOPIC_PER_PARTITION) to control granularity and cost. At the DEFAULT level (free), cluster-level metrics are available; higher levels (paid) expose broker-level, per-topic and per-partition metrics.
In this post, I show you how to implement effective monitoring for your MSK clusters using Amazon CloudWatch. You’ll learn how to track critical metrics like broker health, resource utilization, and consumer lag, and set up automated alerts to prevent operational issues. By following these practices, you can work to improve streaming operations reliability, optimize resource usage, and support high availability for your mission-critical applications.
This article groups important Amazon MSK metrics into logical categories. For each, we highlight key metrics and what they indicate:
By grouping metrics into these categories, you can build dashboards and alerts that comprehensively cover Amazon MSK health and performance. Amazon CloudWatch also provides automatic dashboards for Amazon MSK.
Let’s take a quick look on how to access CloudWatch automatic dashboard. In the AWS Console, go to the CloudWatch service. When in the CloudWatch console, select Dashboards. Open the Automatic dashboard tab and search for MSK in the Filter Bar.
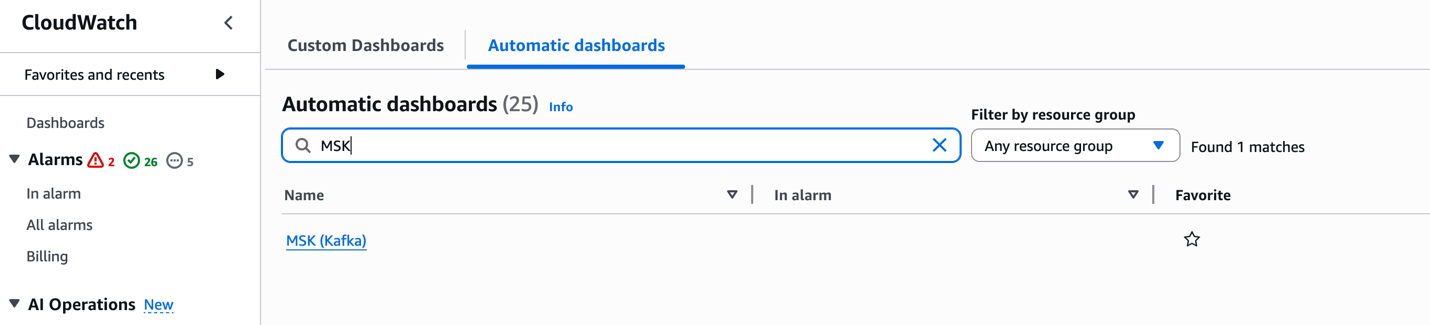
These dashboards offer per-configured visualizations of key metrics, enabling quick insights into the health and performance of your MSK clusters.
Setting alarms on key metrics helps catch issues early. Detecting issues early is crucial in streaming applications where every second counts. A single failing broker can trigger a chain reaction – halting data ingestion, backing up upstream systems, and breaking downstream applications. This can quickly escalate from delayed order processing to lost revenue. Proactive monitoring helps catch and fix problems before they impact your business operations. Based on AWS best practices and experience, consider alarms such as:
These are illustrative thresholds; adjust them for your workload and SLAs. The remaining metrics listed in the CloudWatch metrics for Standard and Express brokers documentation are susceptible to downstream impact from anomalies in the primary metrics above. It is recommended to enable CloudWatch alarms on a single test cluster first to validate thresholds before extending coverage across your MSK fleet.
In this post, we covered the important CloudWatch metrics and alarms for monitoring Amazon MSK clusters effectively. By implementing these recommended alarms, you can proactively detect and respond to potential issues before they impact your Kafka workloads. To learn more about Amazon MSK monitoring, refer to the Amazon MSK Monitoring Best Practices documentation or explore our Amazon MSK Workshops hands-on experience.
Yashika is a Senior Cloud Analytics Engineer at AWS, specializing in real-time analytics and event-driven architectures. She is committed to helping customers by providing deep technical guidance, driving best practices across real-time data platforms and solving complex issues related to their streaming data architectures.